1st, city of gold coast challenge18 jul 2026
beacon
a live map that replays a cyclone and shows who gets trapped.
private repo, no public link
cyclone replay, flood and closures spreading
- eventgold coast open data challenge
- when18 jul 2026
during cyclone alfred the data was out there, but spread over six sites and a list-style dashboard nobody could find mid-storm. one map, one answer was the idea.
the brief was the city's disaster resilience challenge: turn community data into real-time disaster intelligence.
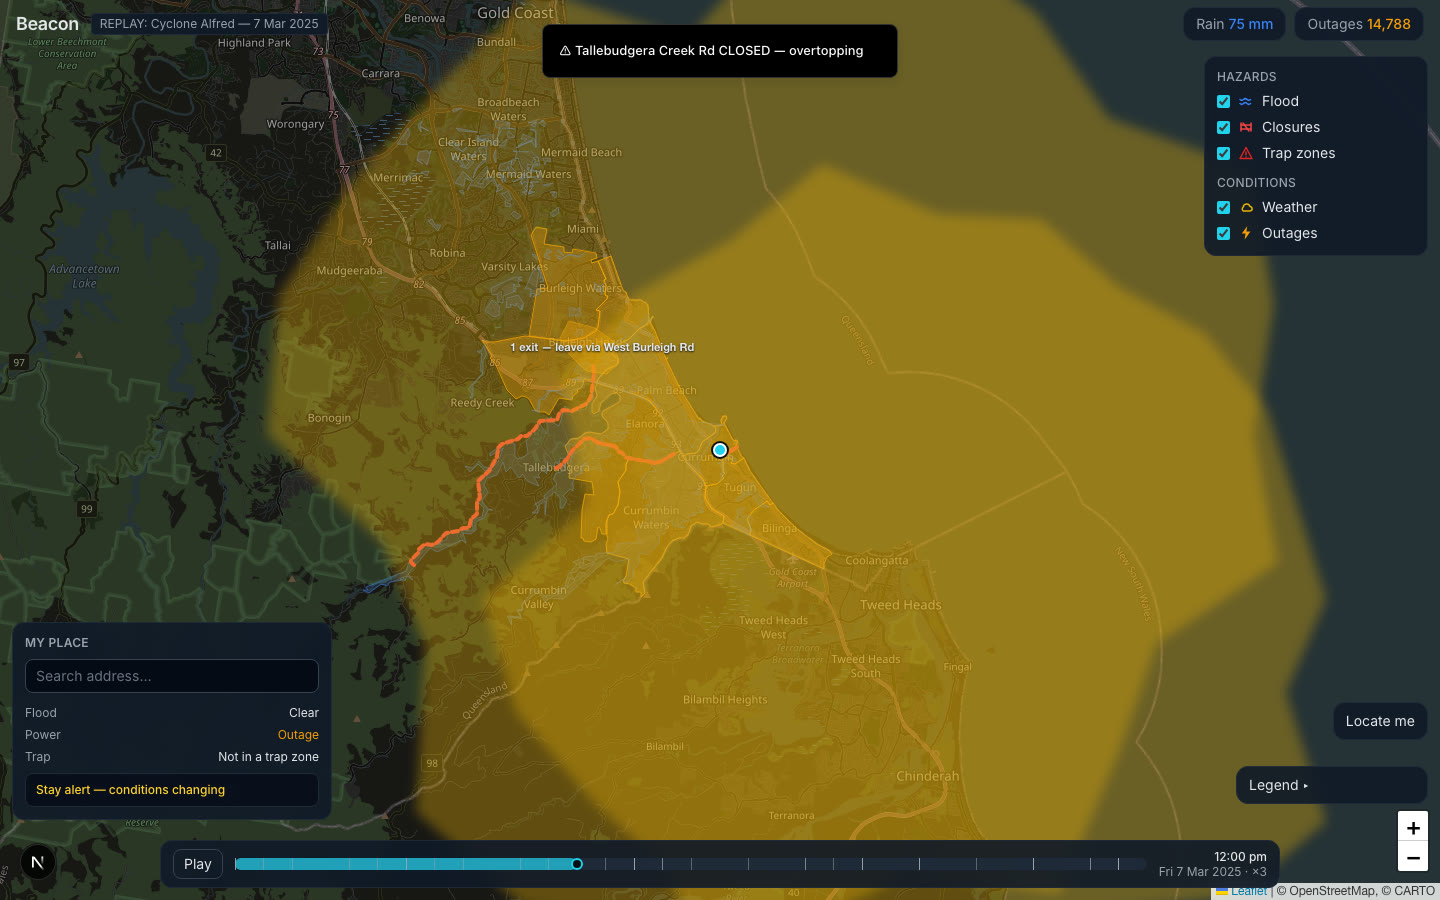
beacon replays alfred (7 mar 2025) on a dark map of the gold coast: weather cells roll in, power outages spread, roads close, flood zones grow.
the part i like most is the trap-zone engine: when closures take a suburb's exits from two to one to none, the pocket pulses amber, then red, and says CUT OFF. a personal "my place" card then flips from ok to leave by 3:30 pm to cut off.
the hard part was making it all line up on one clock, then swapping rough fake data for real city and energy-company data without breaking the story.
we pitched it as groundtruth: easy hazard reports from residents, severity sorted automatically, shown where people are trapped. it took 1st in the city of gold coast challenge.
- one zustand clock drives everything: simulated minutes since 6 am on 7 mar 2025. pure functions in src/lib derive what is closed, flooded or out at that minute, and the leaflet layers redraw from that. no timers per layer, so scrubbing backwards just works (tests cover it).
- stack: next.js (app router, typescript), tailwind, plain leaflet on a dark basemap, zustand, vitest. no backend, no api routes, no keys.
- trap zones: three pockets (Currumbin, Tallebudgera, Bilinga), each with a list of exit roads. as closure events land, the status goes 2 exits, 1 exit (amber pulse plus "leave via ..." label), 0 exits (red, CUT OFF).
- my place: drop a pin by address search, map click or locate-me; point-in-polygon checks flood, power and trap state and produce a one-line verdict, with a toast when the level changes.
- real data in the final version: city flood overlay (CC-BY) split into 6 rainfall stages that spread as cumulative rain rises, 7 roads from the city's road hierarchy data, real suburb boundaries, and 7 mar 2025 energex outage history (9,568 out at 6 am to 23,022 at 10 pm) mined from a public archive by scheduled github actions.
- performance: map layers rebuild only when the active set changes (closed ids, outage ids, flood stage), not on every 250 ms tick, so 500-point real geometries stay smooth.
- 13commits, all 18 jul 2026, first 15:10 and last 18:26 (gchub-hack git log, +1000 timezone)
- 31timeline events in the replay
- 43unit tests in 5 files, all passing
- about 2,300lines of typescript across src
- 5layers: flood, closures, trap zones, weather, outages
- 3repos: the app (beacon), a pitch repo (groundtruth slides, pitch.md and deck), a single-file demo page (groundtruth-demo.html)
- 2-day event, 18-19 jul 2026, Gold Coast Innovation Hub